Data Interpretation Practice Question and Answer
8 Q:Direction: Read the following table carefully and answer the following questions: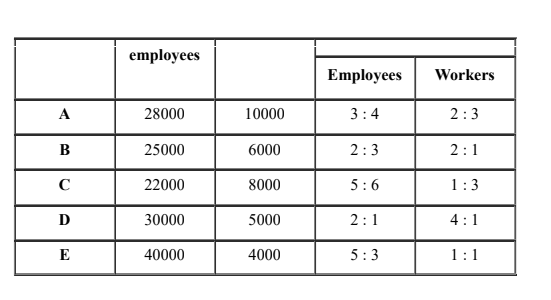
What is the ratio between the number of female workers and female employees of five companies?
753 064d4e3a5d02c5c746bdce983
64d4e3a5d02c5c746bdce983- 11 : 5false
- 21 : 4true
- 32 : 5false
- 41 : 3false
- 52 : 3false
- Show AnswerHide Answer
- Workspace
- SingleChoice
Answer : 2. "1 : 4"
Q:Direction: The line chart given below shows number of labourers (men and women) working in six different years. Study the data carefully and answer the following questions.
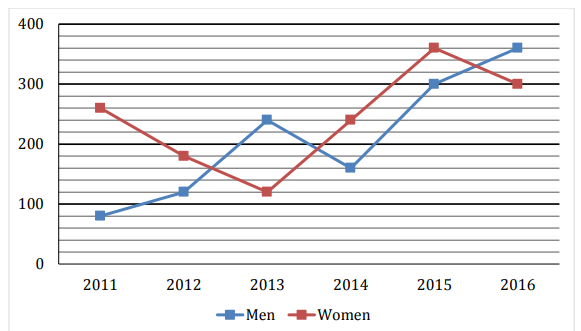
The average number of Women working in 2014, 2015 and 2016 together is how much more/less than average number of Men working in 2011, 2014 and 2016 together?
750 064d4b2f2a798377447221ad1
64d4b2f2a798377447221ad1- 1100true
- 280false
- 390false
- 470false
- 5None of the given optionsfalse
- Show AnswerHide Answer
- Workspace
- SingleChoice
Answer : 1. "100"
Q:Direction: Read the following table carefully and answer the following questions:
The female workers of five companies are how much percent more than the male workers of five companies?
749 064d4e47da79837744722c13d
64d4e47da79837744722c13d- 13.33%false
- 28.5%false
- 312.5%false
- 46.25%true
- 516.66%false
- Show AnswerHide Answer
- Workspace
- SingleChoice
Answer : 4. "6.25%"
Q:Directions : Study the following bar graph and answer the questions.
company (in lakhs of rupees) for the years 1994-1997:
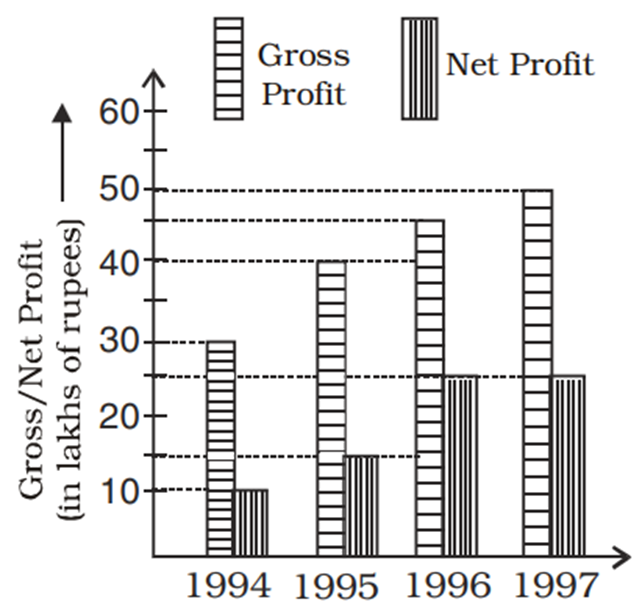
The percentage of net profit of 1995 as compared to the gross profit in that year is
747 06460f549c899b466f4458b03
6460f549c899b466f4458b03- 125.5%false
- 235.5%false
- 337.5%true
- 442.5%false
- Show AnswerHide Answer
- Workspace
- SingleChoice
Answer : 3. "37.5% "
Q:Direction: The line chart given below shows number of labourers (men and women) working in six different years. Study the data carefully and answer the following questions.
Find the ratio between total number of Labors working in 2012 and 2013 together to total number of labors working in 2015 and 2016 together.
746 064d4b4859ce88dacc34350c3
64d4b4859ce88dacc34350c3- 12: 1false
- 21: 2true
- 335: 66false
- 411: 10false
- 5None of the given optionsfalse
- Show AnswerHide Answer
- Workspace
- SingleChoice
Answer : 2. "1: 2"
Q:Directions : The bar graph, given here, shows the demand and production of colour televisions of five companies for Diwali season in the year 2009. Study the graph carefully and answer the questions based on the graph.
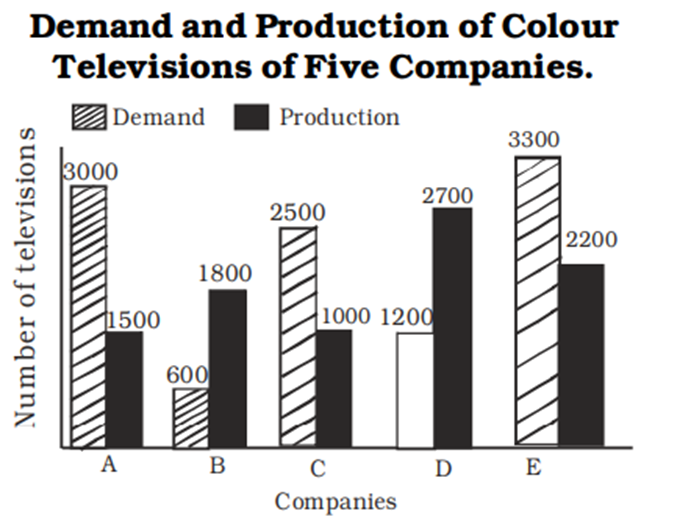
The demand of colour televisions of company B is appoximately what per cent of that of company C ?
745 06460f985cdae930acb746845
6460f985cdae930acb746845- 160%false
- 225%false
- 324%true
- 46%false
- Show AnswerHide Answer
- Workspace
- SingleChoice
Answer : 3. "24% "
Q:Directions : The bar graph, given here, shows the demand and production of colour televisions of five companies for Diwali season in the year 2009. Study the graph carefully and answer the questions based on the graph.
The ratio of the demand and production of colour televisions of company E is :
744 06460f911f75f230a7a71eb22
6460f911f75f230a7a71eb22- 13 : 2true
- 22 : 3false
- 32 : 1false
- 41 : 2false
- Show AnswerHide Answer
- Workspace
- SingleChoice
Answer : 1. "3 : 2 "
Q:Direction: Read the following table carefully and answer the following questions:
Find the average male employees of five companies.
740 064d4e32aebd5c3747278ec73
64d4e32aebd5c3747278ec73- 115600false
- 216400false
- 315400true
- 416600false
- 514400false
- Show AnswerHide Answer
- Workspace
- SingleChoice