Data Interpretation Practice Question and Answer
8 Q:Direction: Read the following table carefully and answer the following questions: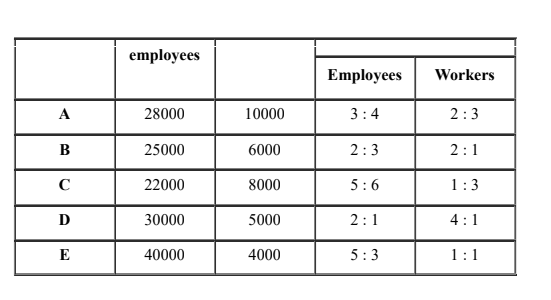
The male workers are approximately what percent of the total workers of five companies?
734 064d4e85280ef1e74b4d412c9
64d4e85280ef1e74b4d412c9- 145%false
- 242%false
- 338%false
- 452%false
- 548%true
- Show AnswerHide Answer
- Workspace
- SingleChoice
Answer : 5. "48%"
Q:Directions: Following is the pie-chart showing the spending of a family on various items in a particular year
Study the pie chart and answer questions
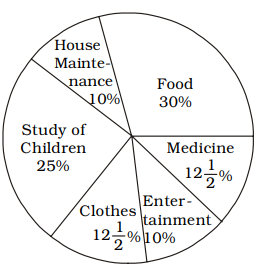
If the total amount spent on the family during the year was ₹ 50,000, how much they spent for buying clothes?
733 063be6f4861d62119f1dbc38c
63be6f4861d62119f1dbc38c- 1₹ 6,250true
- 2₹ 6,500false
- 3₹ 7,250false
- 4₹ 7,500false
- Show AnswerHide Answer
- Workspace
- SingleChoice
Answer : 1. "₹ 6,250 "
Q:Directions: Study the following bar graph carefully to answer the questions.
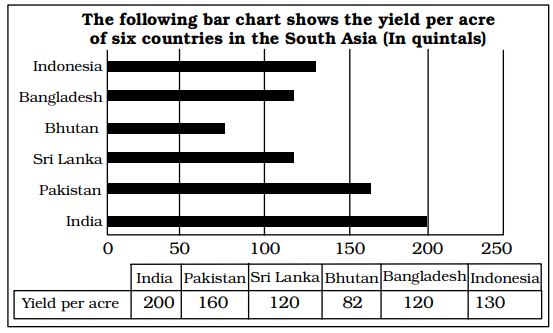
If the yield per acre is arranged in ascending order, then what is the difference between the yield per acre of first three countries and last three countries?
732 06464a417c899b466f44ffcd4
6464a417c899b466f44ffcd4- 1168 quintalstrue
- 2172 quintalsfalse
- 3182 quintalsfalse
- 4190 quintalsfalse
- Show AnswerHide Answer
- Workspace
- SingleChoice
Answer : 1. "168 quintals "
Q:Directions: The bar diagram given below shows the productions (in the unit of thousand pieces) of three types of biscuits by a company in the five consecutive years. Study the diagram and answer the following questions.
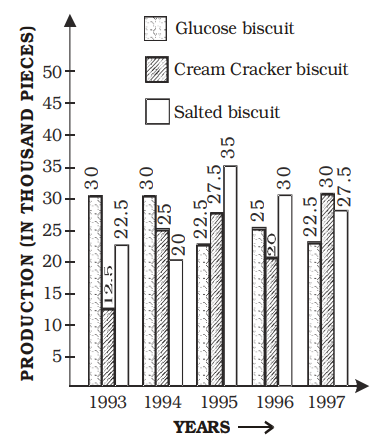
Total production of all the three types of biscuits was the least in the year
732 064899fa923e51f4777206be8
64899fa923e51f4777206be8- 11993true
- 21997false
- 31996false
- 41995false
- Show AnswerHide Answer
- Workspace
- SingleChoice
Answer : 1. "1993 "
Q:Direction: Read the following table carefully and answer the following questions:
Find the difference between the female employees of company D and female workers of the same company.
731 064d4e42180ef1e74b4d4105b
64d4e42180ef1e74b4d4105b- 18000false
- 27000false
- 310000false
- 49000false
- 512000true
- Show AnswerHide Answer
- Workspace
- SingleChoice
Answer : 5. "12000"
Q:Directions: Study the Bar diagram carefully and answer the questions.
The Bar diagram shows the trends of foreign direct investment (FDI) into India from all over the World (in Rs. crores).
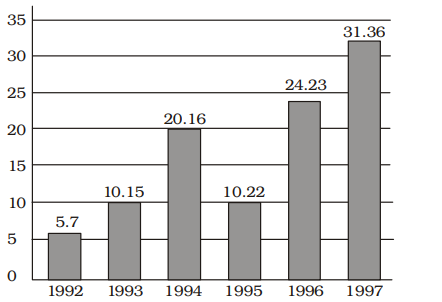
The year which exhibited the 2nd highest growth percentage in FDI in India over the period shown is
728 063a56a668fc9692134068b08
63a56a668fc9692134068b08 - 11993false
- 21994false
- 31997false
- 41996true
- Show AnswerHide Answer
- Workspace
- SingleChoice
Answer : 4. "1996"
Q:Direction: The line chart given below shows number of labourers (men and women) working in six different years. Study the data carefully and answer the following questions.
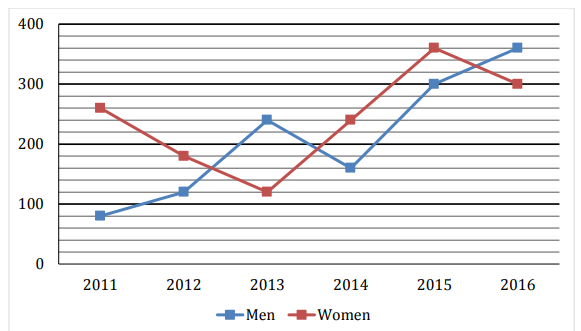
The number of Men working in 2017 is 15% more than that of 2015 while the number of Women working in 2017 is 40% less than that of 2014. Find the total number of labourers (Men + Women) working in 2017.
723 064d4b3979ce88dacc34344f7
64d4b3979ce88dacc34344f7- 1561false
- 2456false
- 3489true
- 4594false
- 5630false
- Show AnswerHide Answer
- Workspace
- SingleChoice
Answer : 3. "489"
Q:Directions: Study the following bar graph carefully to answer the questions.
The yield per acre produced by Bangladesh is what percent of the total yield per acre produced by all countries?
722 06464a562c899b466f4501a21
6464a562c899b466f4501a21- 114%false
- 213.5%false
- 314.8%true
- 416%false
- Show AnswerHide Answer
- Workspace
- SingleChoice