Bar Graph Questions and Answers for Bank Exams


Bar Graph Questions and Answers for Competitive Exams
Direction (Question 11 to 15): Study the following bar-graph and answer the question given below
Production of Fertilizers by a company (in 10000 tonnes) over the Years.
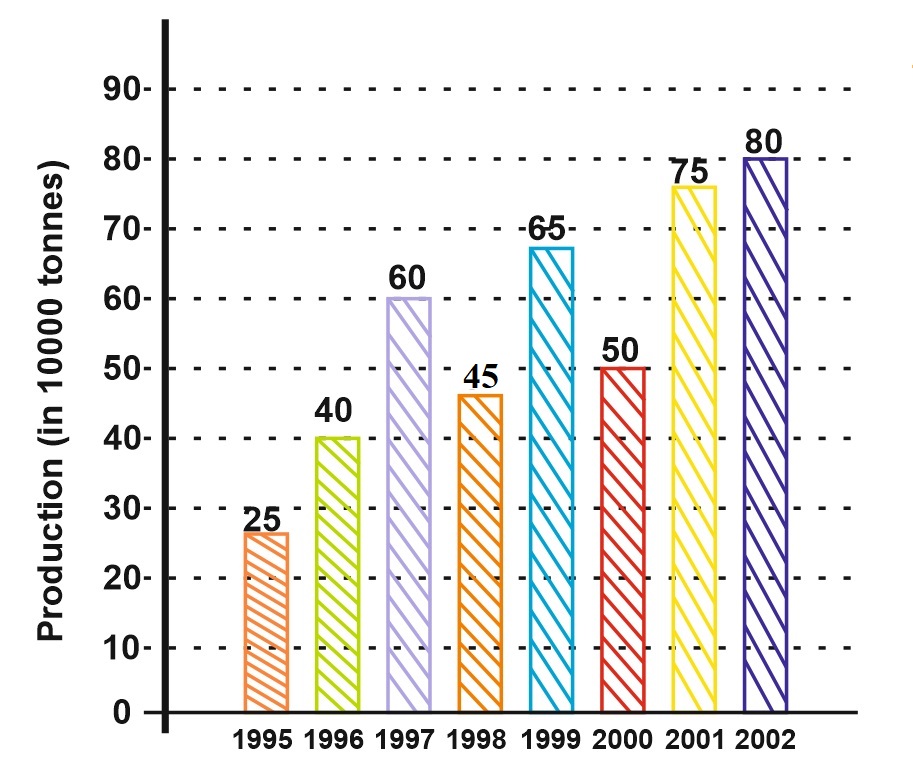 Q.11. In how many of the given years was the production of fertilizers more than the average production of the given years?
(A) 1
(B) 2
(C) 3
(D) 4
(E) 5
Ans . D
Q.12. The average production of 1996 and 1997 was exactly equal to the average production of which of the following pairs of years?
(A) 2000 and 2001
(B) 1999 and 2000
(C) 1998 and 2000
(D) 1995 and 1999
(E) 1995 and 2001
Ans . E
Q.13. What was the percentage decline in the production of fertilizers from 1997 to 1998?
(A) 33%
(B) 30%
(C) 25%
(D) 21%
(E) 20%
Ans . C
Q.14.In which years was the percentage increase in production as compared to the previous year the maximum?
(A) 2002
(B) 2001
(C) 1999
(D) 1997
(E) 1996
Ans . E
Q.15. What was the percentage increase in production of fertilizers in 2002 compared to that in 1995?
(A) 320%
(B) 300%
(C) 220%
(D) 200%
(E) 150%
Ans . C
Students can ask in comment section anything about bar graph questions and answers if they face any difficulty in bar graph questions and answers. Go to next page for more practice bar graph questions and answers for SSC and Bank Exams.
Showing page 3 of 4
enhttps://www.examsbook.com/bar-graph-questions-and-answers-for-bank-exams/343bar-graph-questions-and-answers-for-bank-examsAbout author

Vikram Singh
Providing knowledgable questions of Reasoning and Aptitude for the competitive exams.
Read more articles