Line Graph Questions and Answers for SSC and Bank Exams


Here are the important and selective line graph questions and answers for SSC and Bank exams, from which usually students are confused about solving them in the examinations. Line graph questions are not difficult, you just have to need to practice these line graph questions with answers to get good marks in the examinations.
Every student wants to achieve better rank in their competitive exams but without practice nothing possible. So keep practice with these line graph questions and answers for SSC, Bank Exam and other competitive exams.
If you are preparing for any competitive exams like SSC, IBPS PO, Bank exam, etc. these Bar graph questions with answers, Tabulation or table chart question-answers blogs will be very helpful for you.
You can read also: Pie chart questions and answers.
Line Graph Questions and Answers for Competitive Exams
Directions (Question 1 to 5): The following line-graph gives the ratio of the amounts of imports by a Company to the amount of exports from that Company over the period from 1995 to 2001. The question given below is based on this graph.
Ratio of value of Imports to Exports by a company over the years.
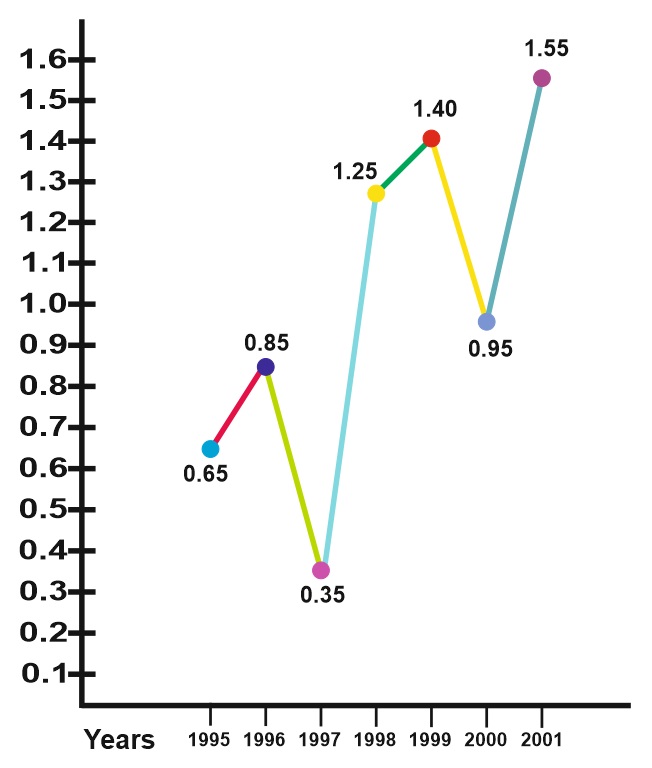
Q.1. In how many of the given years were the exports more than the imports?
(A) 1
(B) 2
(C) 3
(D) 4
(E) None of these
Ans . D
Q.2. The imports were minimum proportionate to the exports of the Company in the year:
(A) 1995
(B) 1996
(C) 1997
(D) 2000
(E) 2001
Ans . C
Q.3. If the imports of the company in 1996 was Rs. 272 crores, the exports from the company in 1996 was:
(A) Rs. 370 cores
(B) Rs. 320 cores
(C) Rs. 280 cores
(D) Rs. 275 cores
(E) Rs. 264 cores
Ans . B
Q.4. What was the percentage increase in imports from 1997 to 1998?
(A) 72
(B) 56
(C) 28
(D) None of these
(E) Data inadequate
Ans . E
Q.5. If the important in 1998 was Rs. 250 crores and the total exports in the years 1998 and 1999 together was Rs. 500 crores, then the imports in 1999 was:
(A) Rs. 250 crores
(B) Rs. 300 crores
(C) Rs. 357 crores
(D) Rs. 420 crores
(E) None of these
Ans . D
Directions (Question 6 to 13): The following line-graph gives the annual percent profit earned by a company during the period 1995-2000. Study the line graph and answer the question that are based on it
Percent profit Earned by a Company Over the Years
![]()
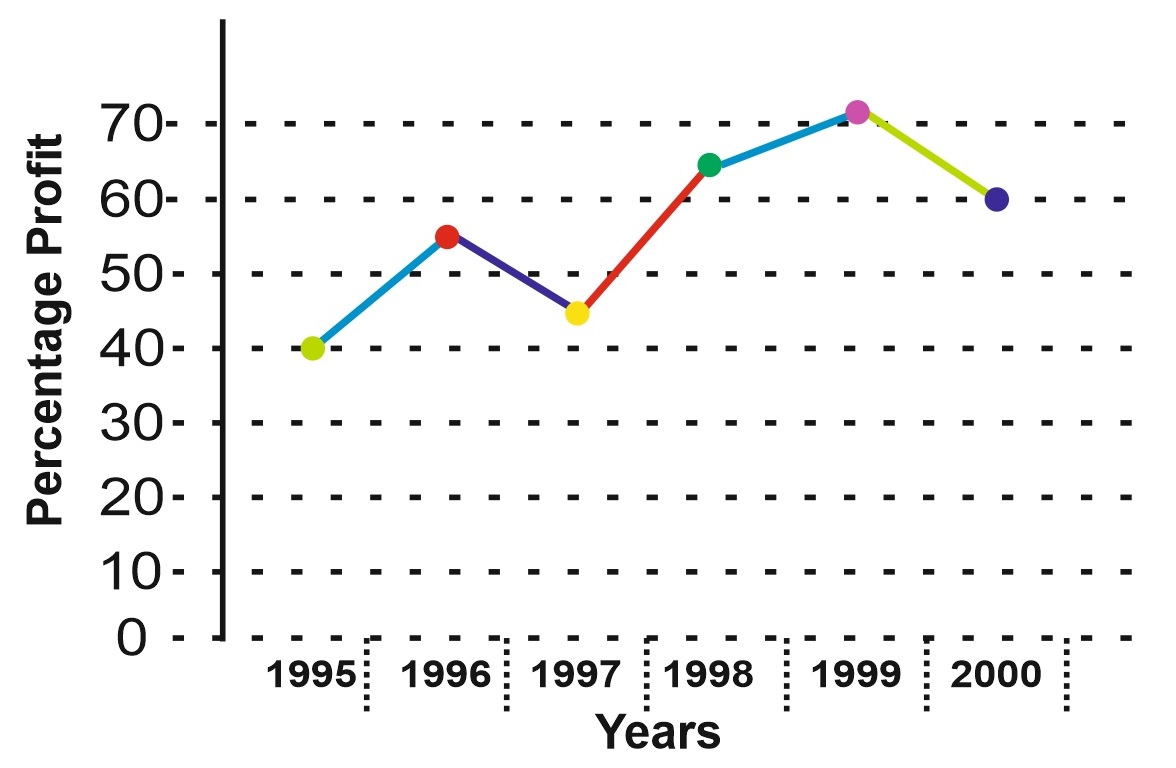
Q.6. If the income in 1998 was Rs. 264 cores, what was the expenditure in 1998?
(A) Rs. 104 crores
(B) Rs. 145 crores
(C) Rs. 160 crores
(D) Rs. 185 crores
(E) None of these
Ans . C
Q.7. During which of the following years was the ratio of income to expenditure the minimum?
(A) 1996
(B) 1997
(C) 1998
(D) 1999
(E) 2000
Ans . B
Q.8. What is the average profit earned for the given years?
(A) ![]()
(B) ![]()
(C) ![]()
(D) 335
(E) None of these
Ans . B
Students can ask in comment section anything related line graph questions and answers if they face any difficulty in line graph questions and answers. Go to next page for more practice line graph questions and answers for SSC and Bank Exams.
Showing page 1 of 3
enhttps://www.examsbook.com/line-graph-questions-and-answers-for-ssc-and-bank-exams31line-graph-questions-and-answers-for-ssc-and-bank-examsAbout author

Vikram Singh
Providing knowledgable questions of Reasoning and Aptitude for the competitive exams.
Read more articles