Data Interpretation Question and Answer for Competitive Exams


The bar chart given below shows the exports (in ₹000) and imports (in ₹000) of a country for 5 consecutive years.
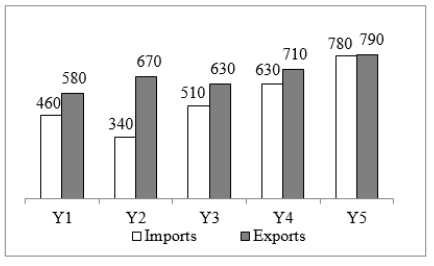
What is the positive difference in the total export figures of all the five years taken together and the total import figures of all the five years taken together?
(A) ₹6,20,000
(B) ₹5,40,000
(C) ₹5,80,000
(D) ₹6,60,000
Correct Answer : D
The following pie chart shows the sectors representing the shares of the number of electric buses manufactured in each of 7 different colours in a given year in terms of the central angles (in degrees) with respect to the total number of buses manufactured during that year of all the 7 colours taken together.
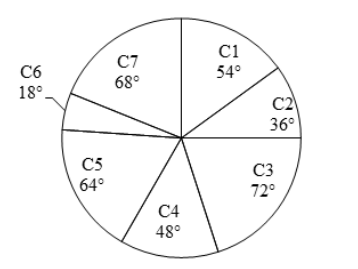
What is the difference in the percentage shares of buses of C4 and C6? [Give your answer correct to 2 decimal places.]
(A) 11.11%
(B) 8.33 %
(C) 9.09 %
(D) 12.5 %
Correct Answer : B
The table below gives the ranks secured by five different students in three different subjects in a qualifying examination:
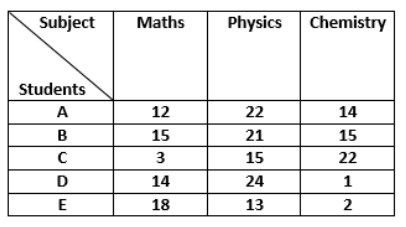
Find the positive difference between the ranks secured by A in Physics and in Maths.
(A) 25
(B) 10
(C) 15
(D) 20
Correct Answer : B
The following bar graph shows the number of students who like four different colours.
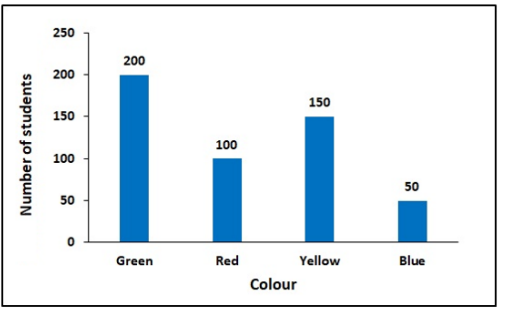
(A) 100
(B) 125
(C) 50
(D) 60
Correct Answer : A
Study the given pie-chart and answer the question that follows.
The pie-chart shows the percentage distribution of the number of different types of chocolates distributed by Akanksha to the residents of a children's home, as percentages of all the chocolates taken together, that were distributed by her to these residents.
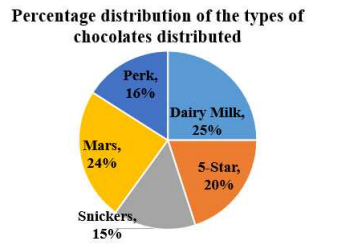
The average number of chocolates of Dairy Milk, 5-Star and Snickers taken together is equal to the number of chocolates distributed of which of the given types?
(A) 5-Star
(B) Daily Milk
(C) Perk
(D) Mars
Correct Answer : A
The following table shows the number of laptops sold from five different stores in a city on five days of a given week.
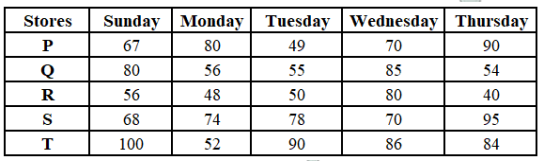
What is the ratio of the total number of computers sold from store S on Tuesday, Monday and Sunday taken together to that sold from store P on Tuesday, Wednesday and Thursday taken together?
(A) 13 : 11
(B) 11 : 15
(C) 11 : 19
(D) 20 : 19
Correct Answer : D
The bar chart given below shows the number of tea packets of 2 varieties sold by 5 shops during a particular week.

What is the average number of tea packets sold per shop, both the varieties take together?
(A) 154.4
(B) 152.8
(C) 157.6
(D) 149.2
Correct Answer : A
The table below shows the number of overs bowled and the number of wickets taken by five bowlers in a match
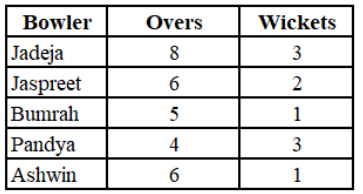
If in each over every bowler bowled 6 balls, in that match which bowler had bowled the highest number of balls per wicket taken by hin1?
(A) Jadeja
(B) Bumrah
(C) Ashwin
(D) Jaspreet
Correct Answer : C
The following pie chart shows the number of bags sold by 7 different shops during a month as percentages of the total number of bags sold during this month by these 7 shops taken together.

If the total number of bags sold during the given month by these 7 shops taken together was 1400, then what was the total number of bags sold by S3 and S 7 taken together?
(A) 240
(B) 196
(C) 224
(D) 210
Correct Answer : C
The following table shows the numbers of chairs made of plastic and of steel in 5 different colours that were sold from a furniture showroom during a sale.
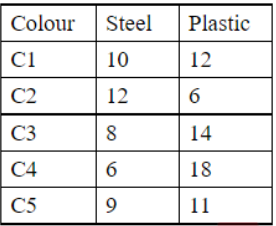
The total number of chairs of colour C3 sold are what percentage of all the chairs of these 5 colours sold, both plastic and steel ones put together? [Give your answer correct to 2 decimal places.]
(A) 17.75%
(B) 20.75%
(C) 14.75%
(D) 23.75%
Correct Answer : B
Showing page 2 of 3
enhttps://www.examsbook.com/data-interpretation-question-and-answer-for-competitive-exams/232data-interpretation-question-and-answer-for-competitive-examsAbout author

Rajesh Bhatia
A Writer, Teacher and GK Expert. I am an M.A. & M.Ed. in English Literature and Political Science. I am highly keen and passionate about reading Indian History. Also, I like to mentor students about how to prepare for a competitive examination. Share your concerns with me by comment box. Also, you can ask anything at linkedin.com/in/rajesh-bhatia-7395a015b/.
Read more articles