Data Interpretation Question and Answer


Direction: Study the following graph carefully and answer the following questions.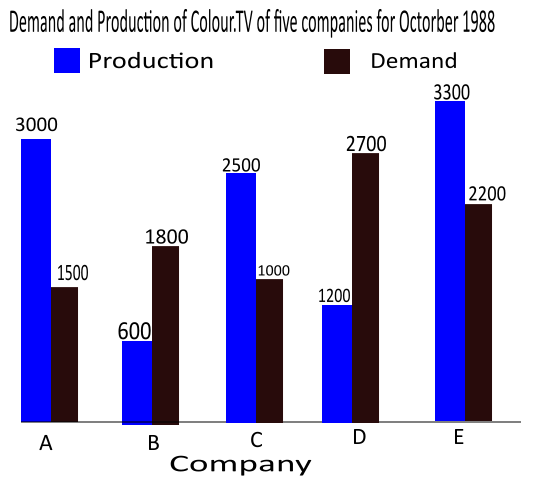
What is the ratio of companies having more demand than production to those having more production than demand?
(A) 4 :1
(B) 3 : 2
(C) 2 : 3
(D) 2 : 2
Correct Answer : C
Study the following table and answer the equation:
Number of cars sold by dealers A, B, C, D and E during first six
months of 2018.
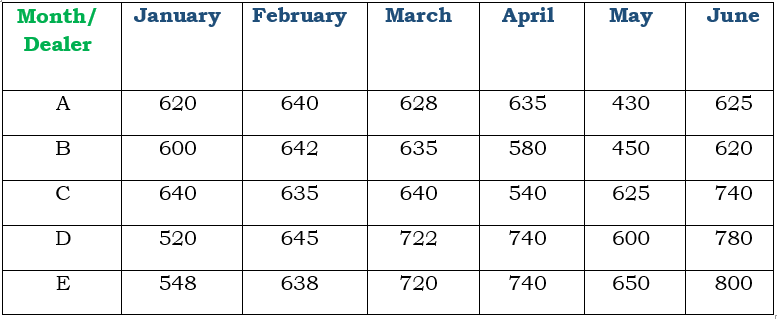
The ratio of the total number of cars sold by dealer B in January, April and June to the total number of cars sold by dealers A and D in March is:
(A) 8:9
(B) 7:5
(C) 4:3
(D) 10:9
Correct Answer : C
Study the following table and answer the equation:
Number of cars sold by dealers A, B, C, D and E during first six
months of 2018.
In July 2018, if the sales of cars by the dealer D increases by the same percentage as in June 2018 over its previous month, then what is the number of cars sold by D in July 2018 ?
(A) 1014
(B) 975
(C) 1020
(D) 959
Correct Answer : A
Direction: The bar graph shows revenues in rupees lakhs from selling four different products (A, B, C and D) by a certain company. Study the diagram and answer the following questions.
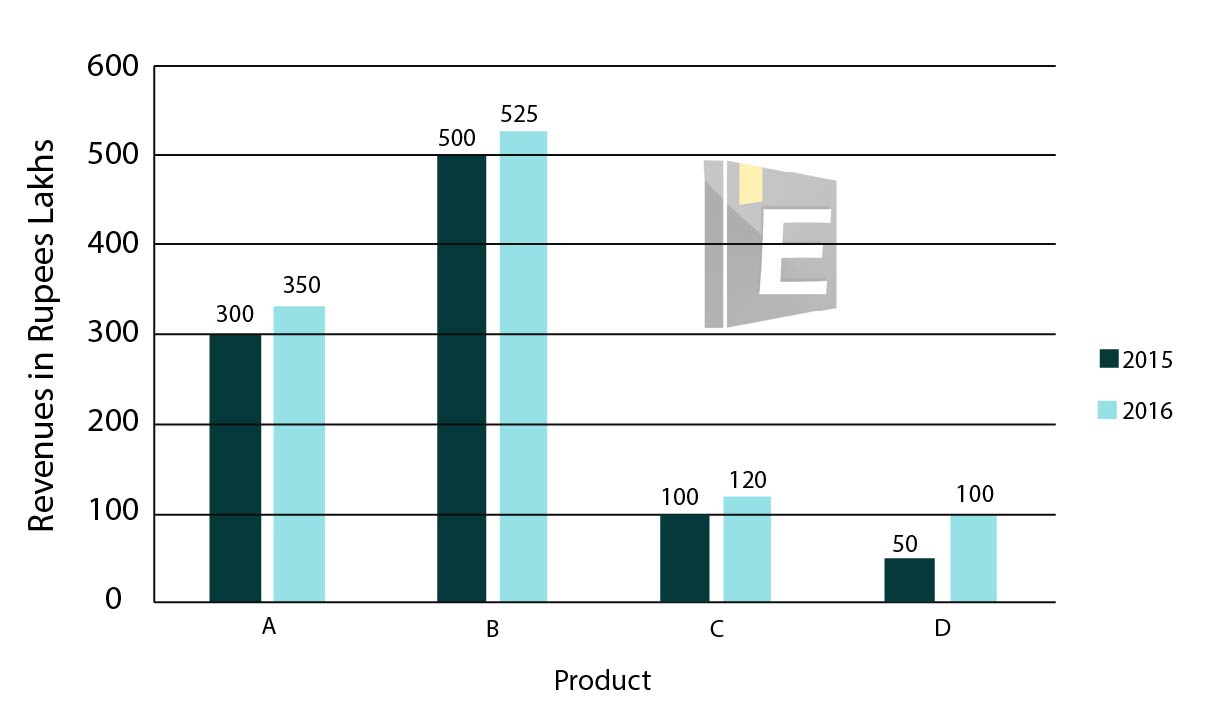
Revenues from which product were the least in both the years 2015 and 2016?
(A) A
(B) B
(C) C
(D) D
Correct Answer : D
Direction: The bar graph shows revenues in rupees lakhs from selling four different products (A, B, C and D) by a certain company. Study the diagram and answer the following questions.
By what value (in %) the revenue from sale of product B in 2016 was greater than that of 2015?
(A) 0.5
(B) 5
(C) 25
(D) 25
Correct Answer : B
Direction: The bar graph shows revenues in rupees lakhs from selling four different products (A, B, C and D) by a certain company. Study the diagram and answer the following questions.
By what amount (in Rs. crore) the total revenue by selling all the four products in 2016 is greater than that of 2015?
(A) 1.5
(B) 1.25
(C) 1
(D) 1.75
Correct Answer : B
Direction: The pie chart shows the breakup of expenditure of a software company for the year 2017. Study the diagram and answer the following questions.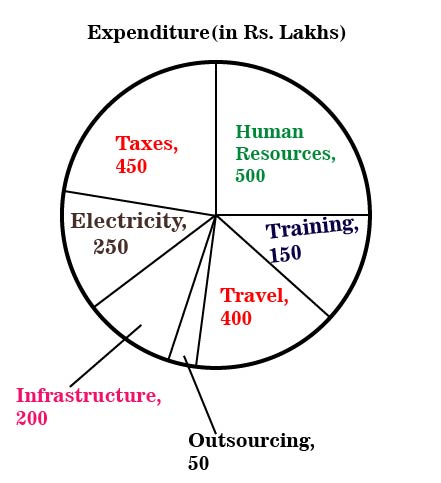
Expenditure on Outsourcing and Infrastructure constitute what percent of total expenditure?
(A) 15%
(B) 10%
(C) 33.3%
(D) 12.5%
Correct Answer : D
Direction: The pie chart shows the breakup of expenditure of a software company for the year 2017. Study the diagram and answer the following questions.
The number of students failed in science is less than the number of students failed in all other subjects by:
(A) 180
(B) 160
(C) 170
(D) 140
Correct Answer : C
Direction: The pie chart shows the breakup of expenditure of a software company for the year 2017. Study the diagram and answer the following questions.
The measure of the central angle of the sector representing Training is ______ degrees.
(A) 27
(B) 30
(C) 33
(D) 24
Correct Answer : A
The following pie diagram gives the marks scored by a student in different subjects - English, Hindi, Mathematics, science and social science in an examination. Assuming that the total marks obtained for the examination are 540, answer the question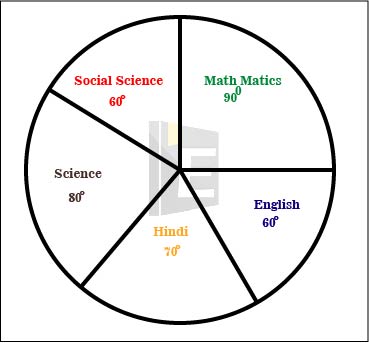
The difference of marks between English and Science is the same as between
(A) English and Hindi
(B) Mathematics and Hindi
(C) Science and Hindi
(D) Hindi and Social science
Correct Answer : B
Showing page 2 of 6
enhttps://www.examsbook.com/data-interpretation-question-and-answer/262data-interpretation-question-and-answerAbout author

Vikram Singh
Providing knowledgable questions of Reasoning and Aptitude for the competitive exams.
Read more articles