Data Interpretation Question and Answer for Competitive Exams


Welcome to our Data Interpretation Question and Answer blog, your go-to resource for unravelling the mysteries of data analysis! In this space, we delve into the realm of interpreting data, offering insights, strategies, and solutions to tackle a variety of data interpretation challenges. Whether you're a student preparing for exams, a professional navigating complex datasets, or simply someone curious about the world of data, our Data Interpretation Question and Answer blog aims to empower you with the knowledge and skills needed to interpret data effectively.
Data Interpretation Question
In this article Data Interpretation Question and Answers for Competitive Exams, we are sharing the latest and most important Data Interpretation Questions under the Aptitude and General Math section for those learners who are preparing for upcoming competitive exams.
Also, Read Latest Current Affairs Questions 2023: Current Affairs Today
"Put your knowledge to the test and excel with our General Knowledge Mock Test and Current Affairs Mock Test!"
Data Interpretation Question and Answer for Competitive Exams
Q : The bar graph given below shows the sales of books (in thousand number) from six branches - B1, B2, B3, B4 , B5 and B6 of a publishing company during two consecutive years 2000 and 2001. Find the percentage (approximate) of the average sales of branches B2, B4 and B6 in the year 2001 to the average sales of branches B1, B3 and B5 in the year 2001.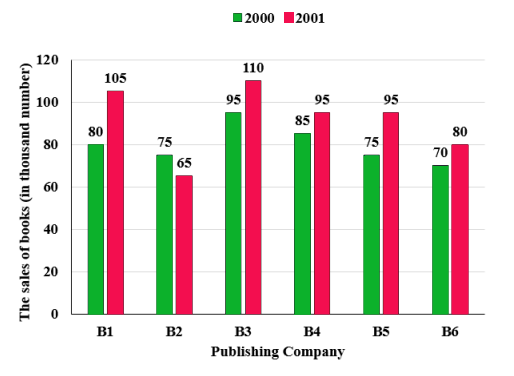
(A) 97.95%
(B) 82.26%
(C) 77.42%
(D) 92%
Correct Answer : C
The following histogram shows the height of players of a basketball team of a school.
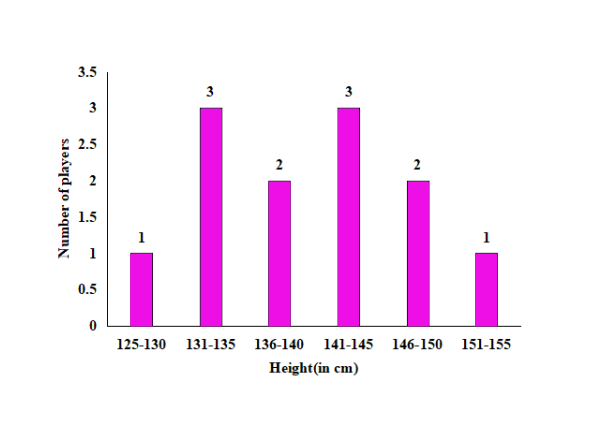
How many players have height less than 141 cm?
(A) 7
(B) 4
(C) 6
(D) 5
Correct Answer : C
The bar graph shows the number of passports issued in a country in 6 consecutive years.
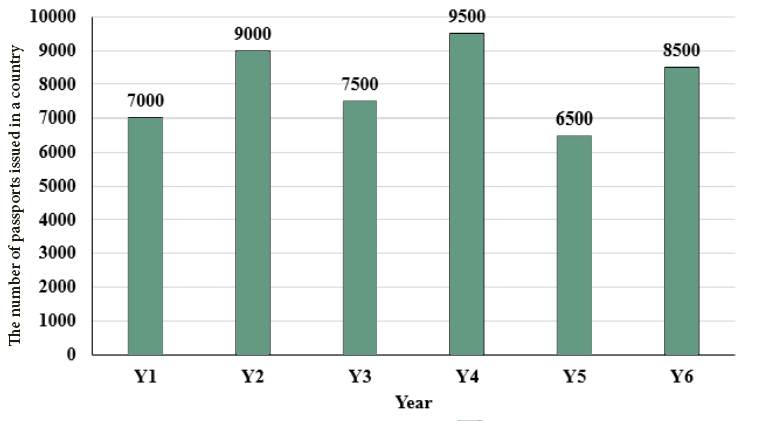
What is the average number of passports issued per year?
(A) 11200
(B) 7600
(C) 8000
(D) 12000
Correct Answer : C
The table given below shows the cost price and selling price of four articles.
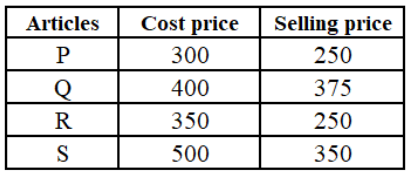
What is the average value of loss of all articles?
(A) 60.75
(B) 95.55
(C) 81.25
(D) 72.24
Correct Answer : C
The bar graph given below shows the production of sugar (in lakh tonnes) by two different companies P and Q for the given years.
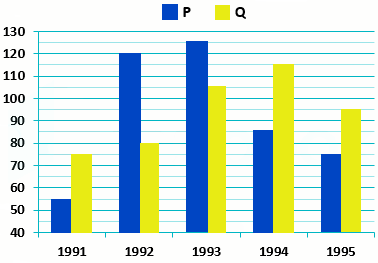
J1 = percentage increase in production of sugar of company P from 1991 to 1995.
J2 = percentage increase in production of sugar of company Q from 1992 to 1994.
What is the value of J1 + J2?
(A) 48 percent
(B) 80.11 percent
(C) 86.22 percent
(D) 76.11 percent
Correct Answer : B
In a school of 200 students, the following chart represents the percentage of students involved in different sports.
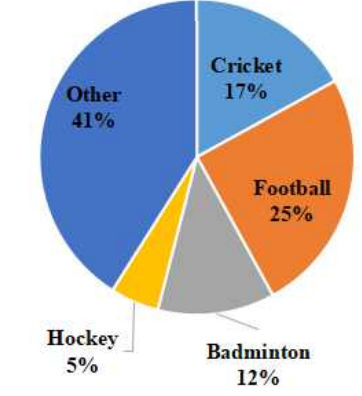
What is the number of students playing cricket?
(A) 17
(B) 83
(C) 24
(D) 34
Correct Answer : B
The table below shows the number of cakes sold by six different bakeries in a town on five different days of particular week.
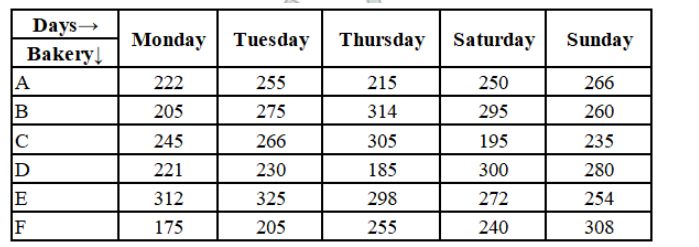
What is the total number of cakes sold by the bakery D on Monday, Thursday and Sunday, taken together?
(A) 779
(B) 668
(C) 530
(D) 686
Correct Answer : D
The following pie chart shows the percentage-wise distribution of the nominal sales figures of laptops of five different companies during a given period.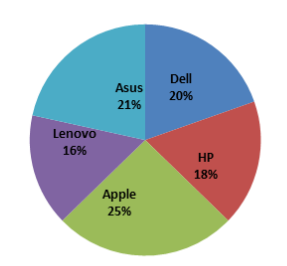
If the total sales of all the companies taken together is ₹55,00,000, then find the difference between the sales of HP and Apple.
(A) ₹ 3,65,000
(B) ₹ 7,50,000
(C) ₹ 4,25,000
(D) ₹ 3,85,000
Correct Answer : D
The following bar graph shows the number of girls in a school over 5 years.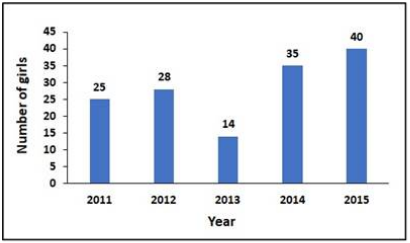
Find the percentage decrease in the number of girls from the year 2012 to the year 2013.
(A) 50%
(B) 40%
(C) 20%
(D) 30%
Correct Answer : A
The following table shows the number of bundles of iron bars of 5 different brands sold from a shop during a given week.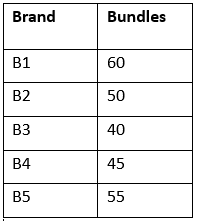
The number of iron bars in each bundle of B1 and B3 is 5. The number of iron bars in each bundle of B2, B4 and B5 is 4. What is the total number of iron bars sold from the shop during that week of all the 5 brands taken together?
(A) 1100
(B) 1200
(C) 1150
(D) 1250
Correct Answer : A
Showing page 1 of 3
enhttps://www.examsbook.com/data-interpretation-question-and-answer-for-competitive-exams31data-interpretation-question-and-answer-for-competitive-examsAbout author

Rajesh Bhatia
A Writer, Teacher and GK Expert. I am an M.A. & M.Ed. in English Literature and Political Science. I am highly keen and passionate about reading Indian History. Also, I like to mentor students about how to prepare for a competitive examination. Share your concerns with me by comment box. Also, you can ask anything at linkedin.com/in/rajesh-bhatia-7395a015b/.
Read more articles